12 Airflow is both a scheduler and an orchestrator
For an indepth Airflow 3.0 Tutorial checkout this article: Free Airflow 3.0 Tutorial
In the previous chapter, we saw how dbt enables data modeling.
However, a data pipeline typically contains more than just data modeling; you will generally need to bring data into the warehouse, model it, run tests on the data, send alerts if the test fails, and so on. This is where Airflow comes in.
Airflow is both an orchestrator and scheduler. With the Airflow paradigms (dags & tasks), you can define the steps to run and their order.
You can also specify the frequency with which to run the pipelines.
We saw how to start and open the Airflow UI at http://localhost:8080 in this chapter.
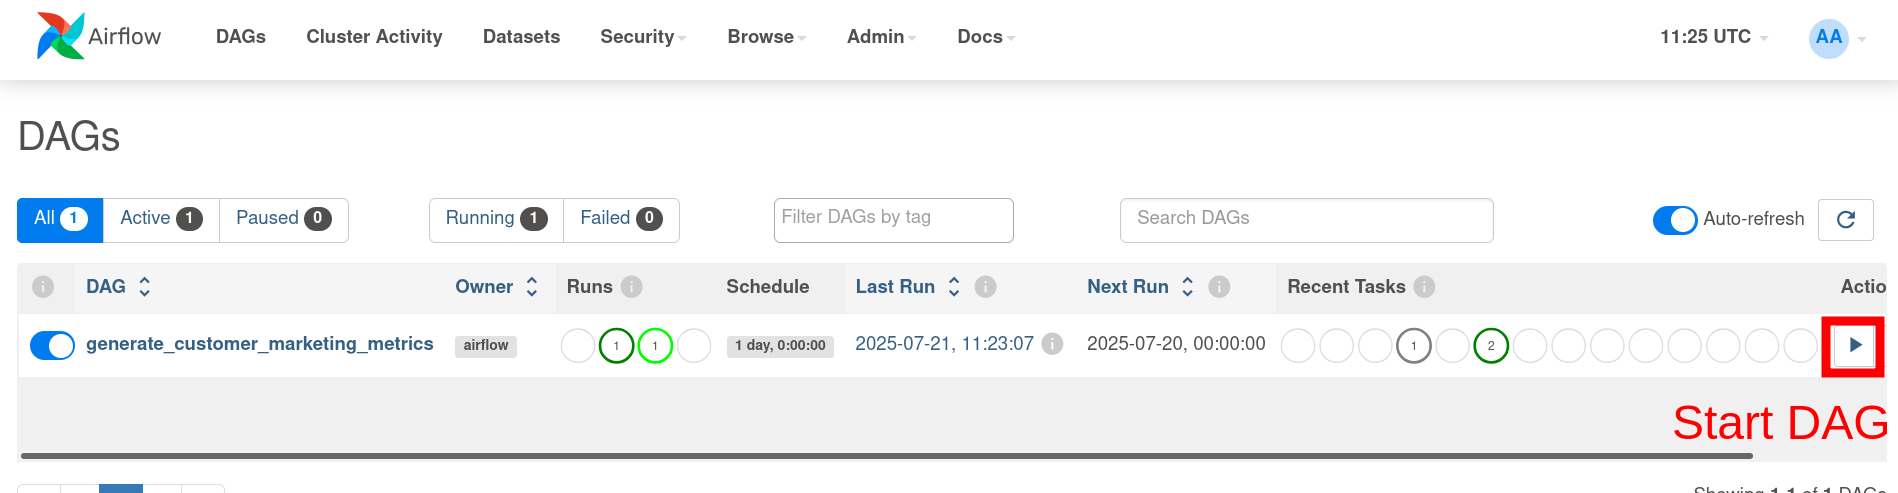
Go ahead and run the dag as shown below and give it a few minutes to complete.
12.1 Airflow DAGs are used to define how, when, and what of data pipelines
Let’s take a look at our DAG.
from datetime import datetime, timedelta
from airflow.decorators import dag
from airflow.operators.bash import BashOperator

default_args = {
    "owner": "airflow",
    "depends_on_past": False,
    "retries": 1,
    "retry_delay": timedelta(minutes=5),
}


@dag(
    dag_id="generate_customer_marketing_metrics",
    description="A DAG to extract data, load into db and generate customer marketing metrics",
    schedule="@daily",
    start_date=datetime(2023, 1, 1),
    catchup=False,
    max_active_runs=1,
    default_args=default_args,
    tags=["marketing", "analytics", "dbt"],
)
def generate_customer_marketing_metrics():
    transform_data = BashOperator(
        task_id="dbt_run",
        bash_command="cd $AIRFLOW_HOME && uv run dbt run --profiles-dir /home/airflow/tpch_analytics/ --project-dir /home/airflow/tpch_analytics/",
    )

    quality_check = BashOperator(
        task_id="dbt_test",
        bash_command="cd $AIRFLOW_HOME && uv run dbt test --profiles-dir /home/airflow/tpch_analytics/ --project-dir /home/airflow/tpch_analytics/",
    )

    generate_docs = BashOperator(
        task_id="dbt_docs_gen",
        bash_command="cd $AIRFLOW_HOME && uv run dbt docs generate --profiles-dir /home/airflow/tpch_analytics/ --project-dir /home/airflow/tpch_analytics/",
    )

    generate_dashboard = BashOperator(
        task_id="generate_dashboard",
        bash_command="cd $AIRFLOW_HOME && uv run python3 /home/airflow/tpch_analytics/dashboard.py",
    )

    transform_data >> quality_check >> generate_docs >> generate_dashboard


generate_customer_marketing_metrics()
In this Python script, we:
- Create a DAG where we define the name, decription, start date, frequency, and the maximum number of concurrent runs, among other parameters. Documentation for all available parameters.
- Create 4 tasks transform_data, quality_check, generate_docs, & generate_dashboard.
- Define the order in which the tasks are to be run as
transform_data >> quality_check >> generate_docs >> generate_dashboard
12.2 DAGs are made up of tasks
In the above example, we saw that the DAG has 4 tasks: transform_data, quality_check, generate_docs & generate_dashboard. A task can be any script from Python, SQL, Pyspark, Java jars, etc.
Airflow offers operators tasks for popular services, such as the S3CreateBucketOperator, which make creating an S3 bucket easy.
Airflow also enables us to create sensors, which are tasks that wait for other tasks/Dags to reach a specific state.
12.3 Airflow configurations are stored at $AIRFLOW_HOME/airflow.cfg
Airflow comes with numerous configuration settings that can be set in the airflow.cfg file.
This configuration file controls settings such as where and how to run our code. Airflow enables us to run our tasks in multiple ways:
- Run code on the same machine as your scheduler process with Local and sequential executor
- Run code in a task queue (i.e., a system that will run tasks on individual machines) with a Celery executor.
- Run code as k8s pods with Kubernetes executor.
- Write custom logic to run your tasks.
It also enables connections to other systems with environment variables, which folder to look for your dag scripts, and many others, see this link.
We can peek into ours by opening our Docker container and viewing them:
docker exec -ti airflow-spark bash
# below commands are run inside the scheduler container
cat $AIRFLOW_HOME/airflow.cfg
cat $AIRFLOW_HOME/airflow.cfg | grep 'executor =' # you will see the executor type that you are running by default
cat $AIRFLOW_HOME/airflow.cfg | grep dags_folder # your dag folder path
12.4 User interface to see how your pipelines are running and their history
As the number and complexity of your data pipelines grow, it is crucial to be able to see precisely how your pipelines are running, detect bottlenecks and delays in data processing, and so on.
Airflow stores information about a pipeline run in its database, and it is viewable via the Airflow UI.
You can open the Airflow UI by going to http://localhost:8080.
12.4.1 See progress & historical information on UI
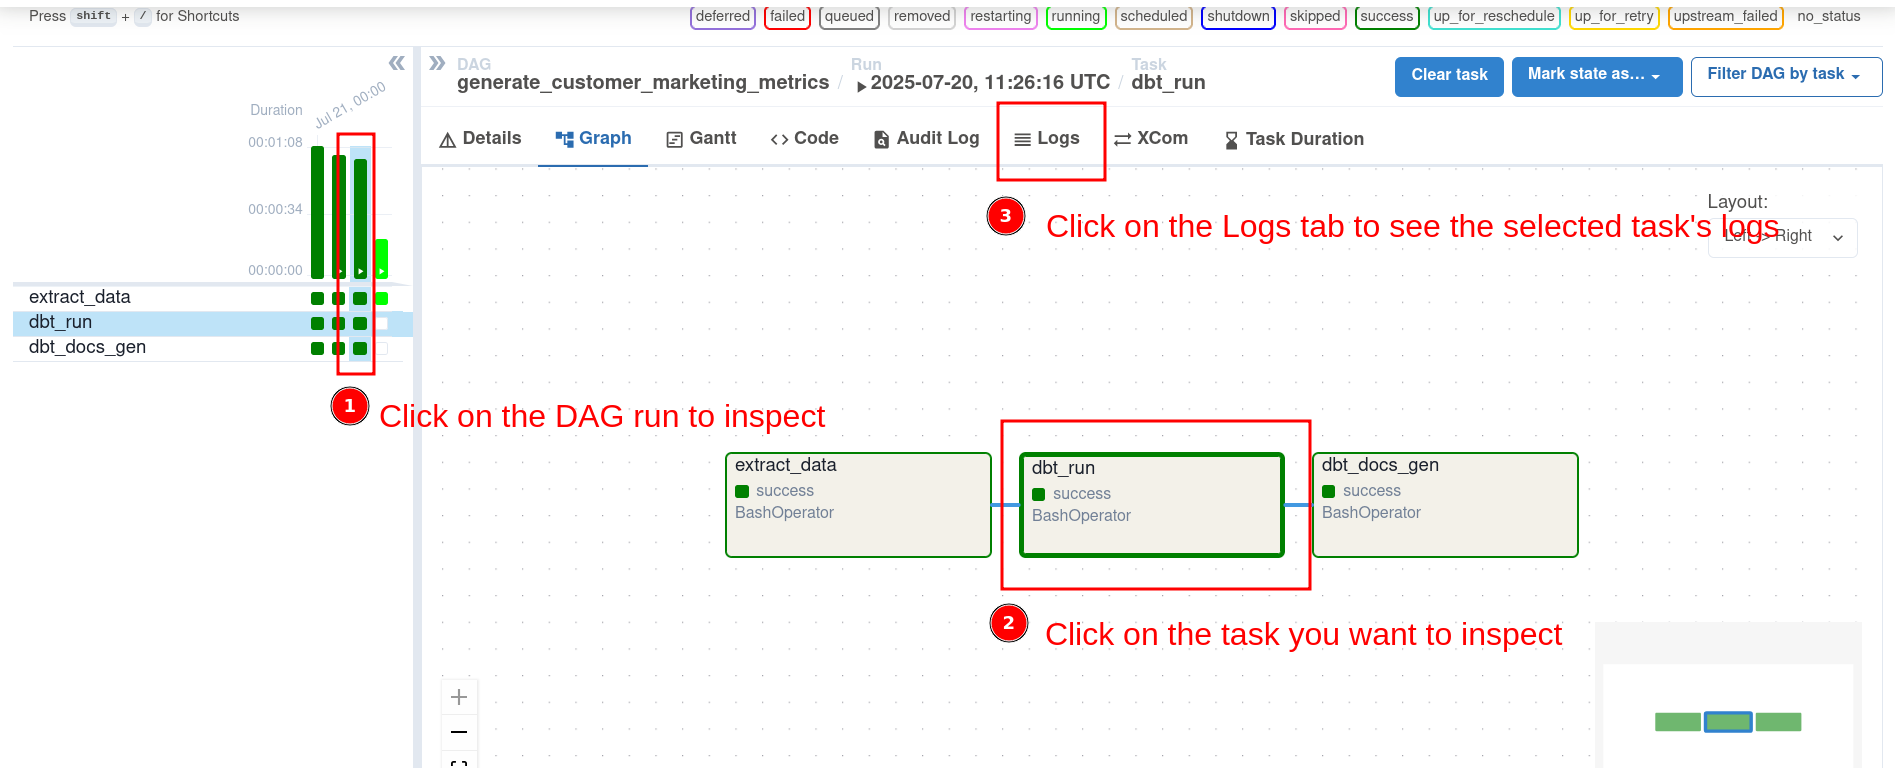
Use the web UI to view progress, failures, and other details, for all the DAG runs. Click on the DAG id and explore the view to see the available information.
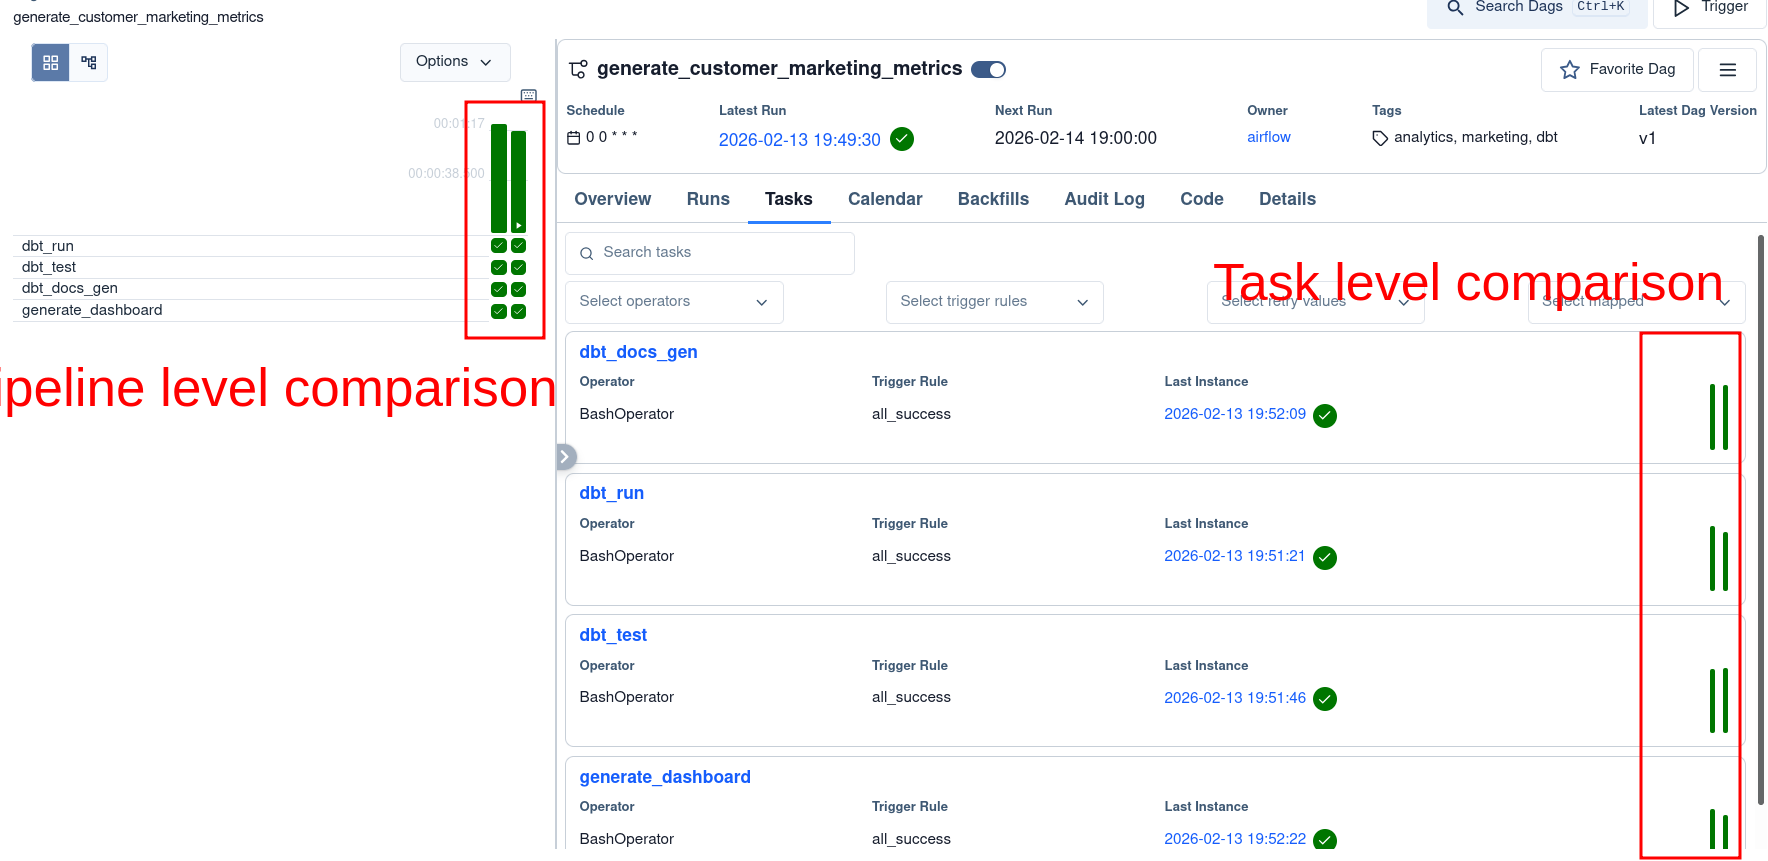
12.4.2 Analyze data pipeline performance with Web UI
We can see how pipelines have performed over time, inspect task run time, and see how long a task had to wait to get started.
The performance metrics provide us with the necessary insights to optimize our systems.
12.4.3 Re-run data pipelines via UI
In addition to seeing how our pipelines are running, we can manually trigger DAGs with custom inputs as necessary.
The ability to trigger/re-run DAGs helps us quickly resolve one-off issues.
See this link for information on triggering dags with UI and CLI.
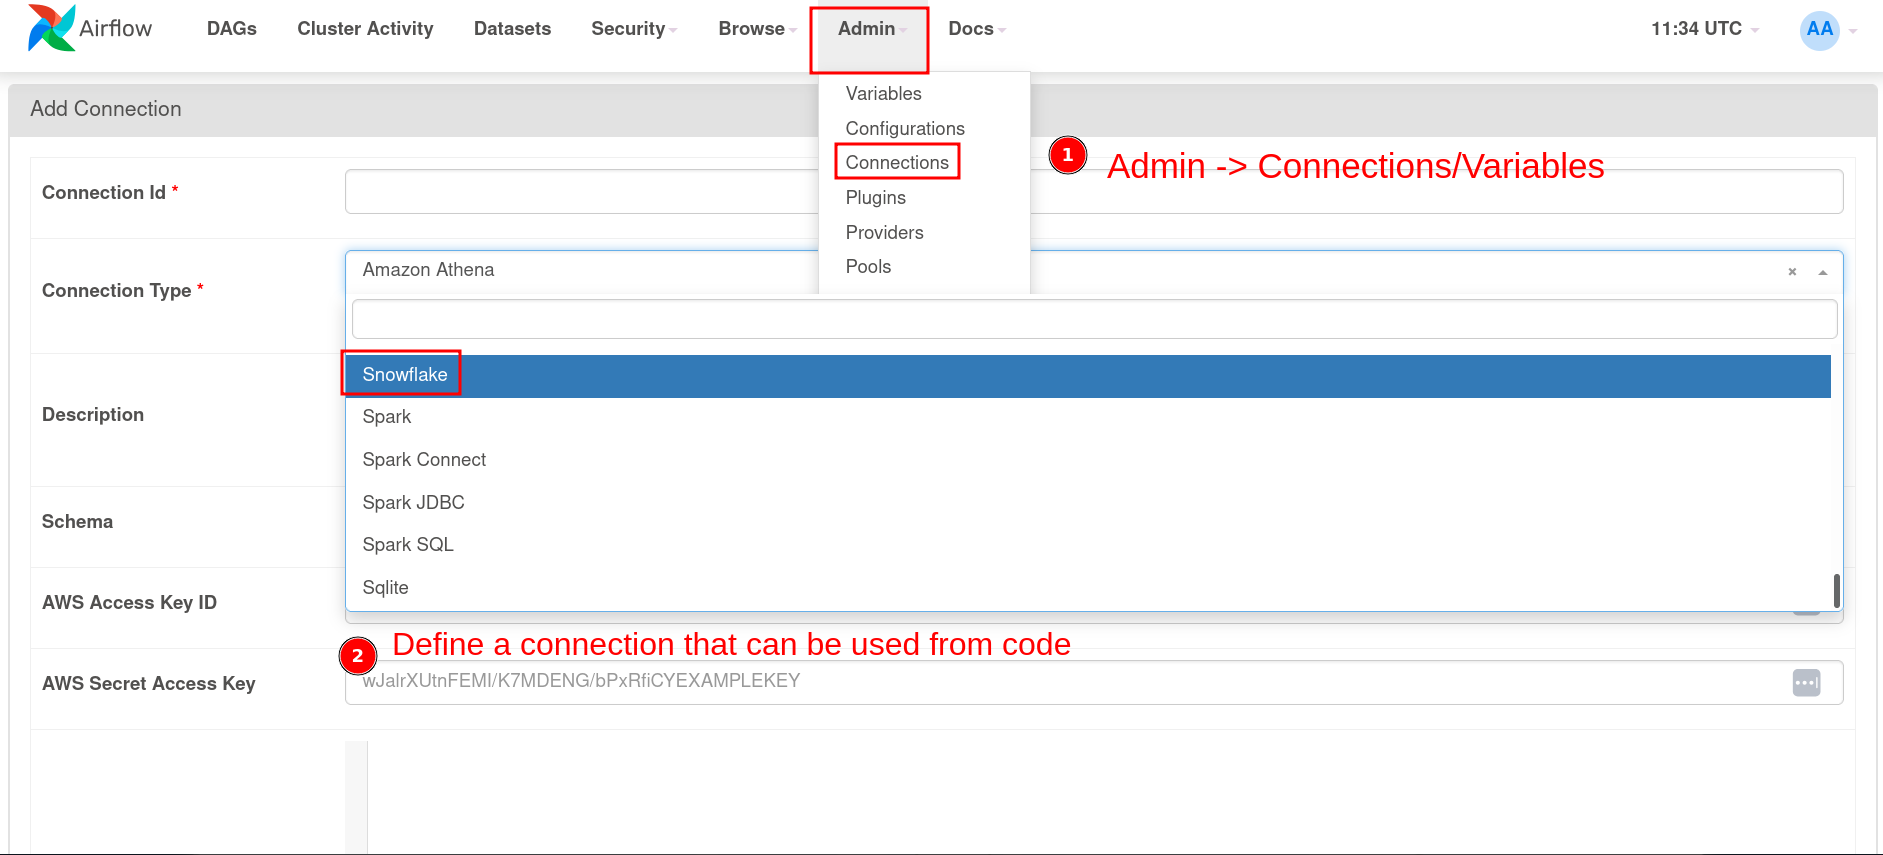
12.4.4 Reuse variables and connections across your pipelines
Apache Airflow also allows us to create and store variables and connection settings that can be reused across our data pipelines.
Variables and connections are significant when you want to use a variable across data pipelines and to connect to external systems, respectively.
Once the connection/variables are set, we can see them in our UI:
Use them in your DAG code by directly accessing them, as shown below.
from airflow.hooks.base import BaseHook
conn = BaseHook.get_connection("your_connection_id")
Alternatively, some operators allow you to enter a parameter called conn_id, which enables you to pass the connection ID and establish a connection to the required service.